13. Status
13.1. System log
When you enter the “Status Information” -> “System Log” interface for the first time, all types of log data for the day are displayed by default.
The log data is classified into levels, currently divided into: all, error warnings, basic settings, security settings, peripheral settings, main unit operations, teaching programs, tool applications, system settings, and file import and export.
There is a search input box in the upper right corner of the data table. Users can enter the filter content according to their search needs. The interface is as follows:
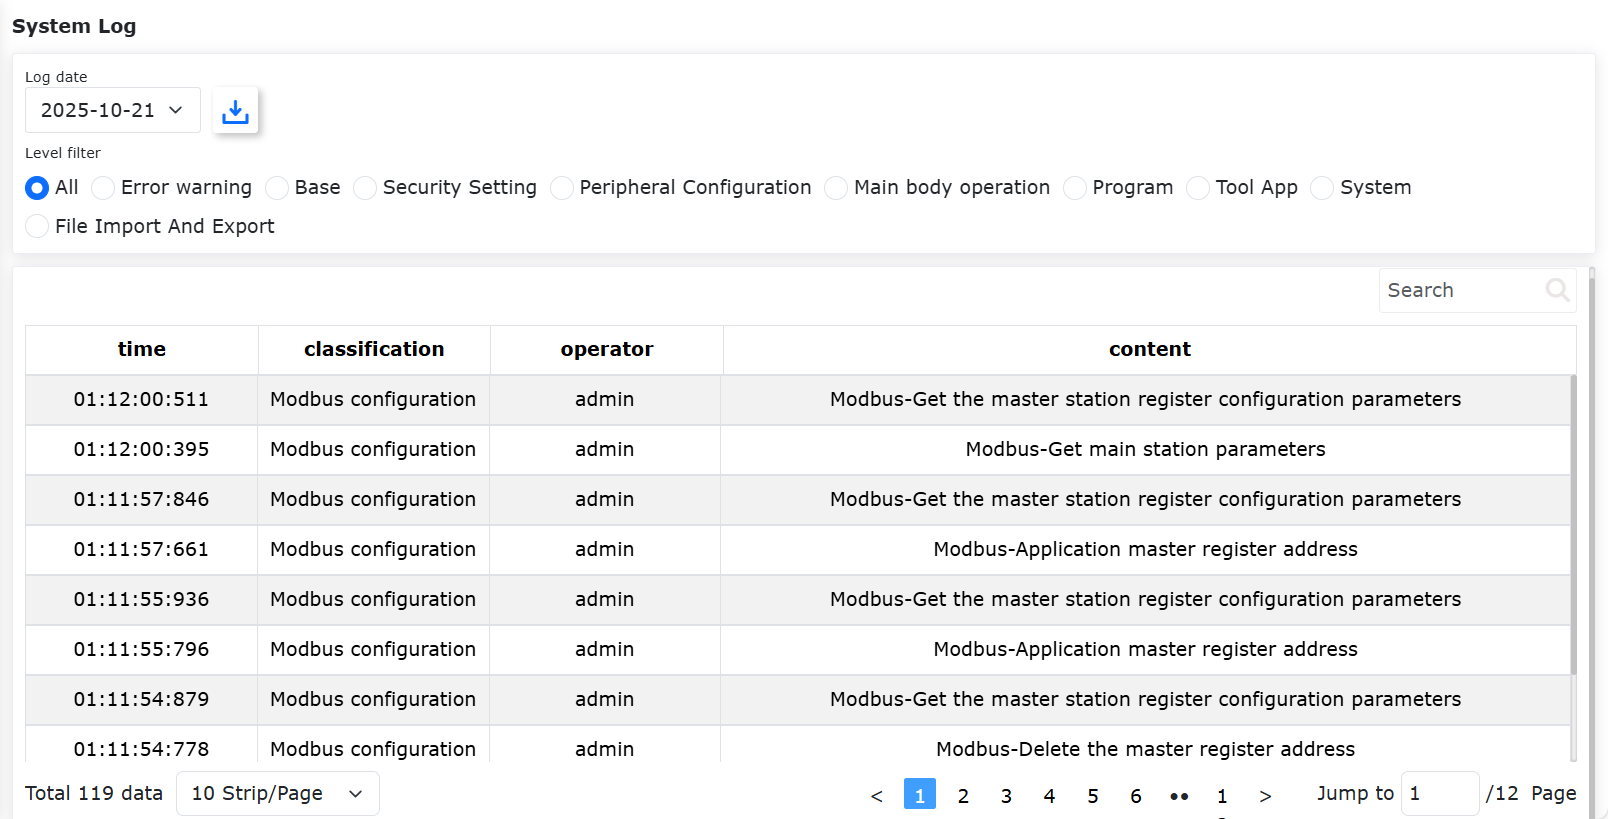
Figure 13.1-1 System log interface
13.2. Status Query
13.2.1. Function Usage
Turn on the control box and connect the Ethernet cable to the PC;
Open a browser on the PC and visit the target URL: 192.168.58.2. Log in with the account “admin” and password “123” to access the page;
Click the “Status Information” -> “Status Query” option in the left menu bar to enter the status query interface, as shown below;
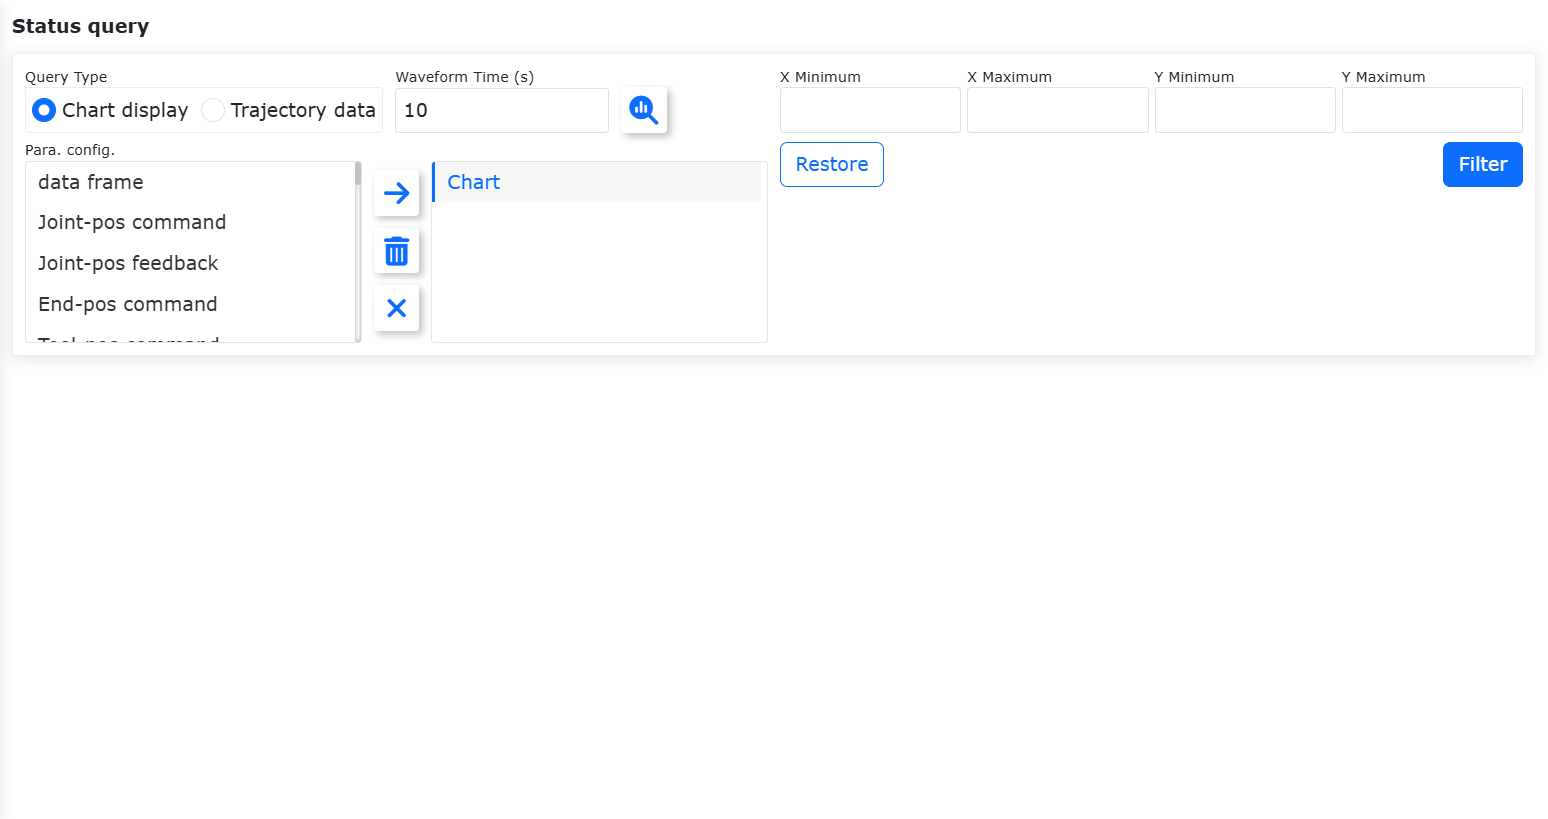
Figure 13.2‑1 Status Query
Note

Name: Query Button
Function: Click to send an instruction to query chart/trajectory data, indicating an unqueried state.
Note

Name: Right Arrow Button
Function: Click to add the selected item on the left to the sub-items on the right.
Note

Name: Delete Button
Function: Click to delete the selected sub-item on the right.
Note

Name: Clear Button
Function: Click to clear all sub-items on the right.
Select “Chart Display,” fill in the waveform time, and choose the desired query parameters in the “Parameter Configuration” section on the left. Click the “Right Arrow” button to add the parameters to the list on the right;
Note
The waveform time can be customized (10-30s), and a maximum of 6 parameters can be selected.
Click the “Query” button to start the query. Based on the parameter configuration, real-time data will be displayed as a line chart, as shown below;
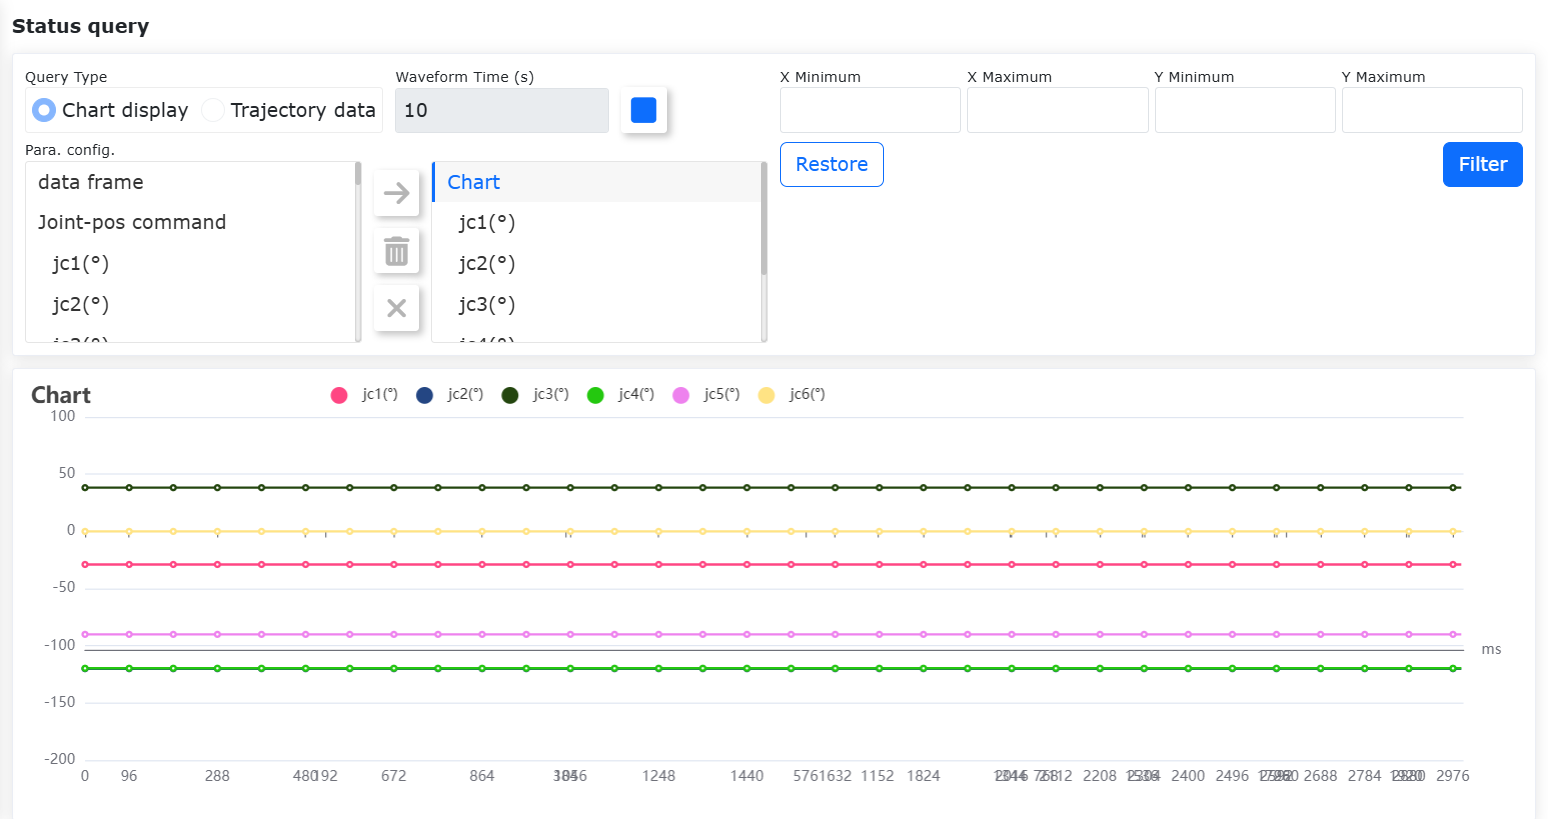
Figure 13.2‑2 Chart Display
13.2.2. Chart Export
Click the chart title to open a dialog box where you can directly modify the title, as shown below:
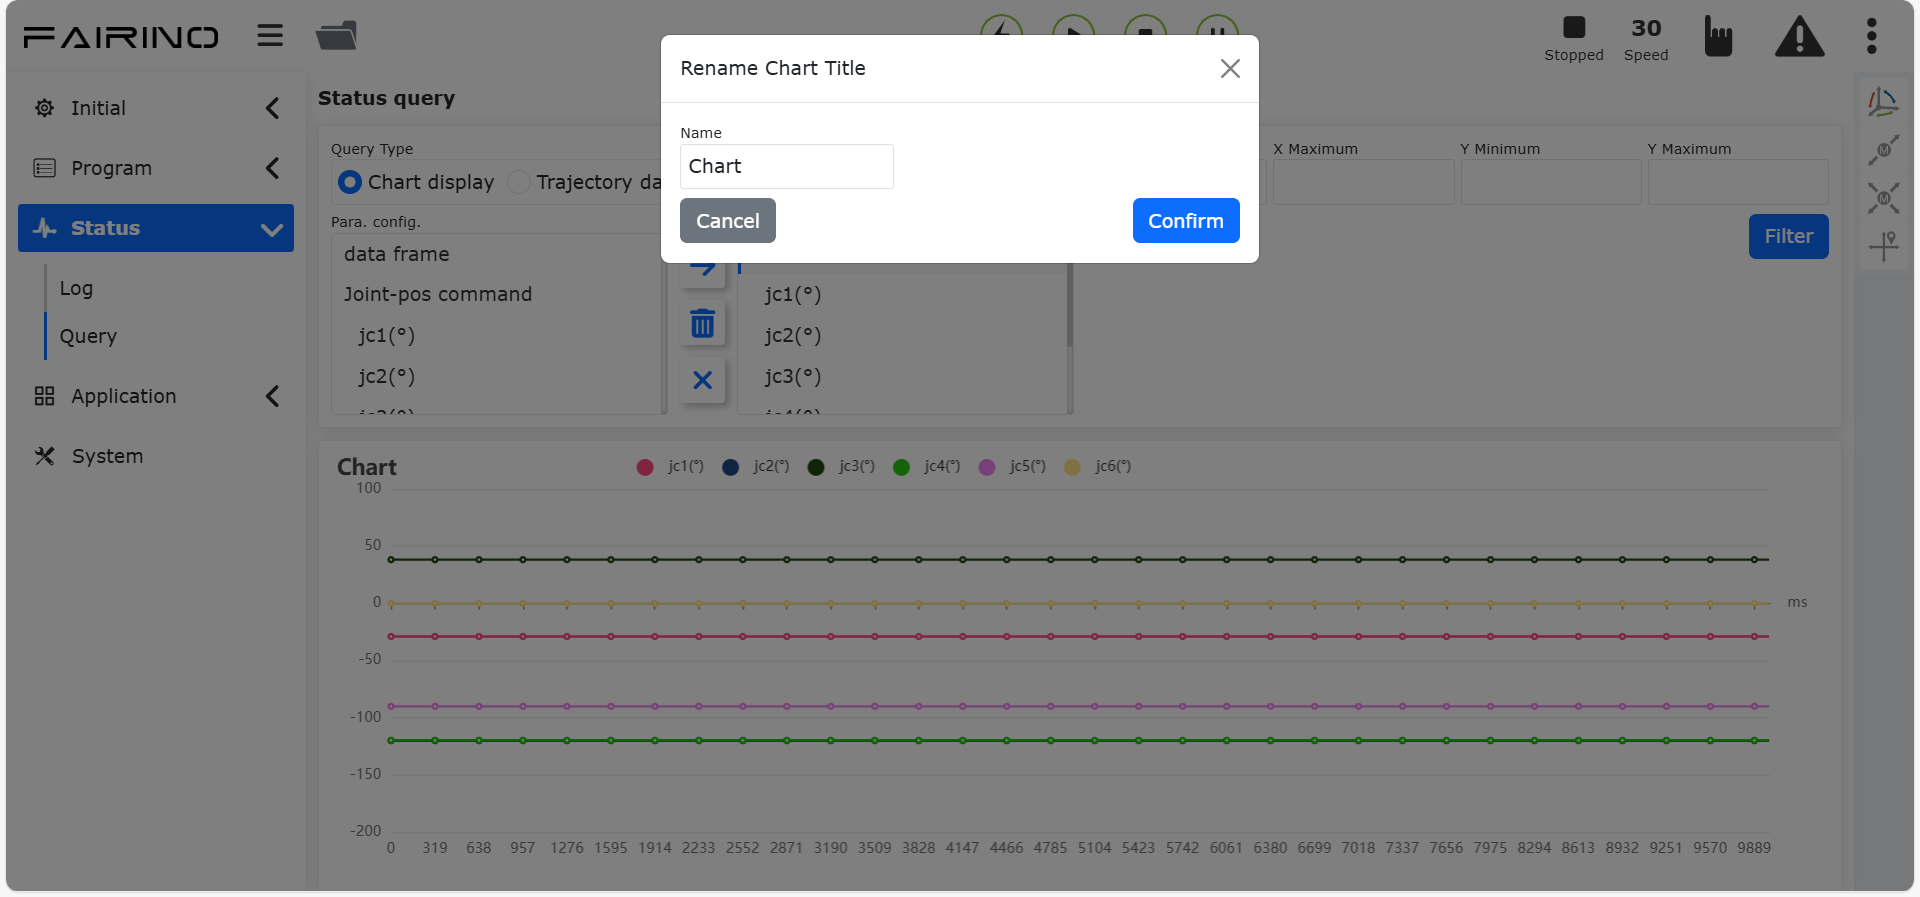
Figure 13.2‑3 Rename Chart Title
After clicking the “Stop Query” button to successfully stop the query, a download button will appear. Click it, and the browser will download the chart file with the chart title as the filename, as shown below:
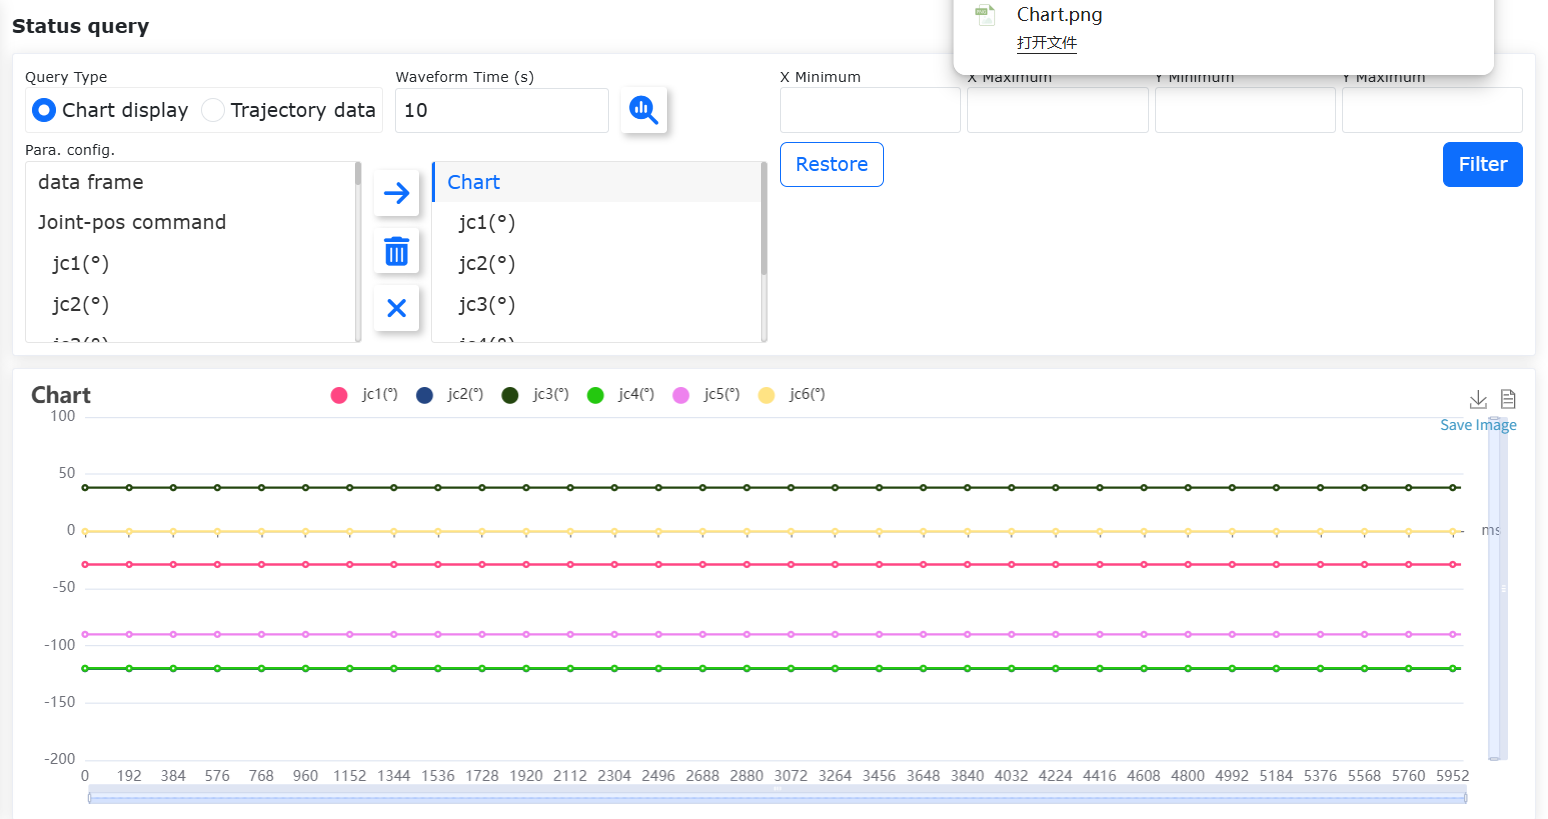
Figure 13.2‑4 Chart Export
13.2.3. Data View Display
After stopping the query, click the “Show Data View” button in the upper-right corner of the chart, as shown below:
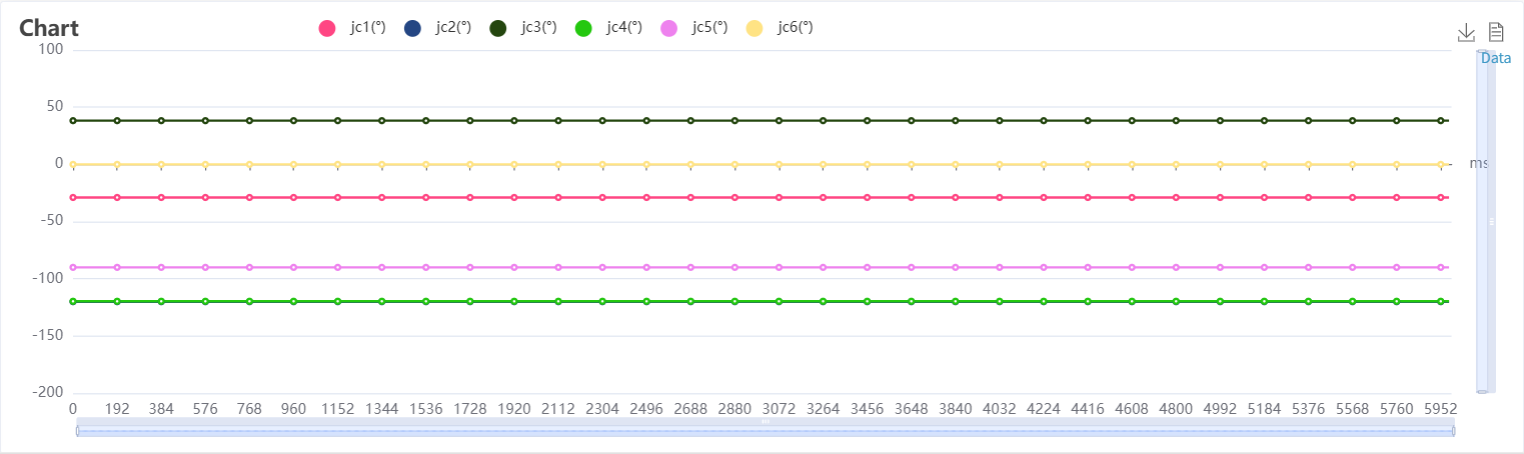
Figure 13.2‑5 Data View Button
The data in the view is shown below, and the content supports copying.
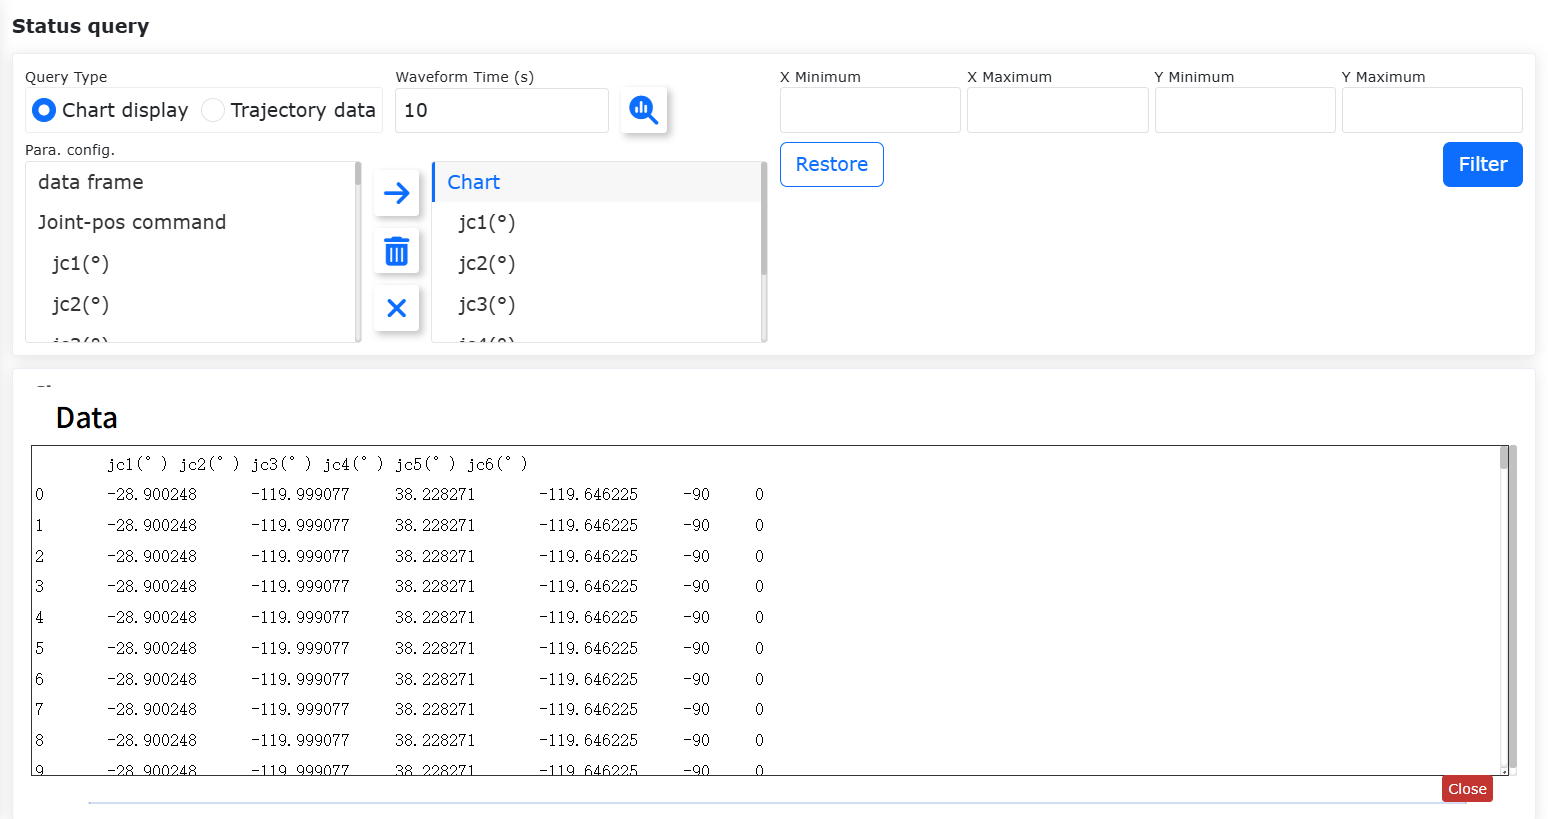
Figure 13.2‑6 Data View Display
13.2.4. Data Filtering
After stopping the query, input the minimum/maximum values for x/y, and the chart data range will change accordingly, as shown in the figure below:
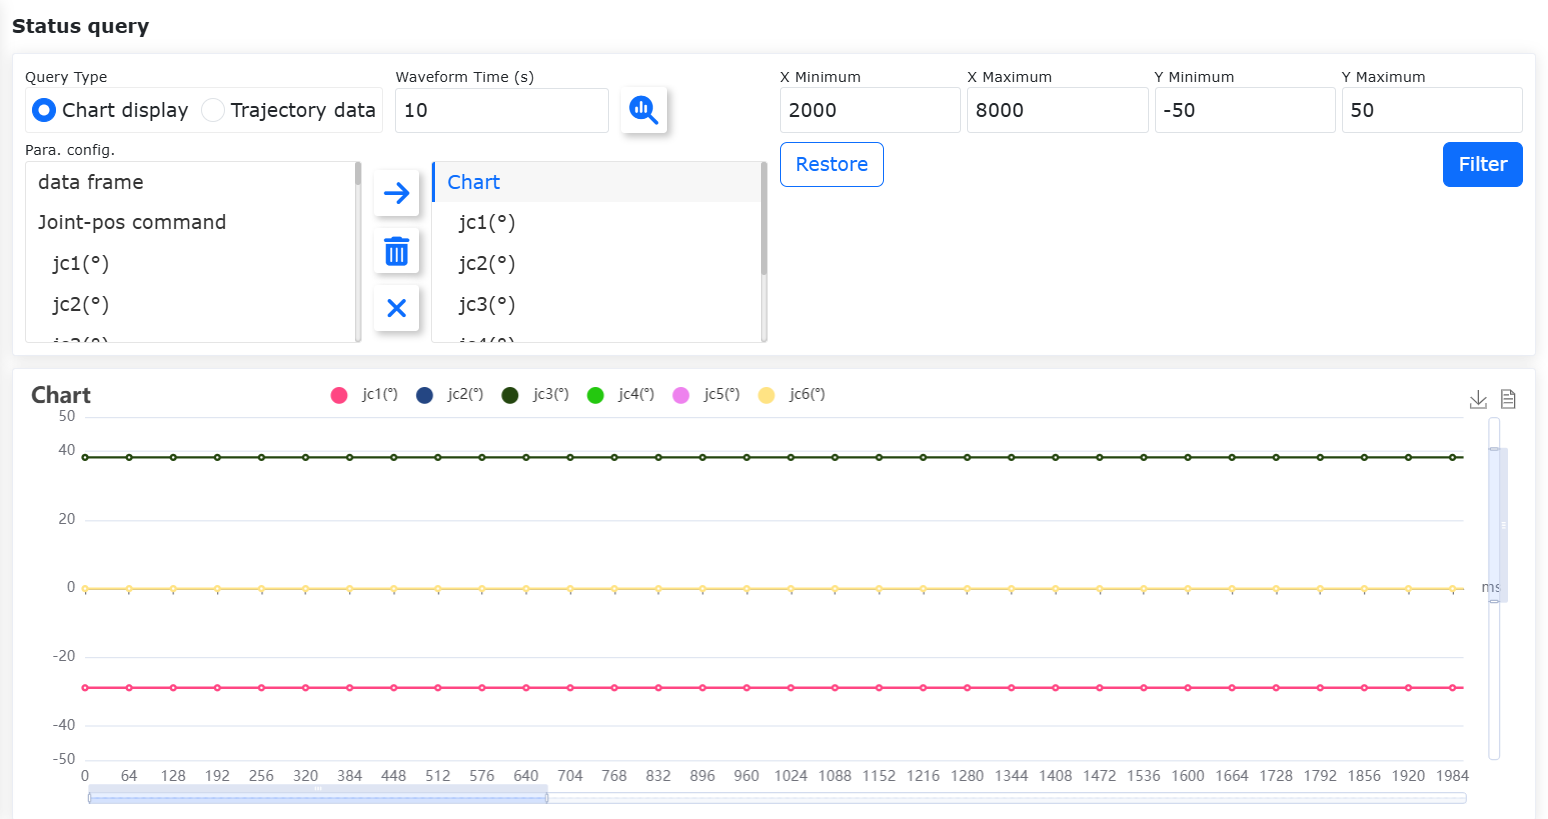
Figure 13.2‑7 Data Filtering Interface
Click the restore button, and the chart data range will revert to the default, as shown in the figure below:
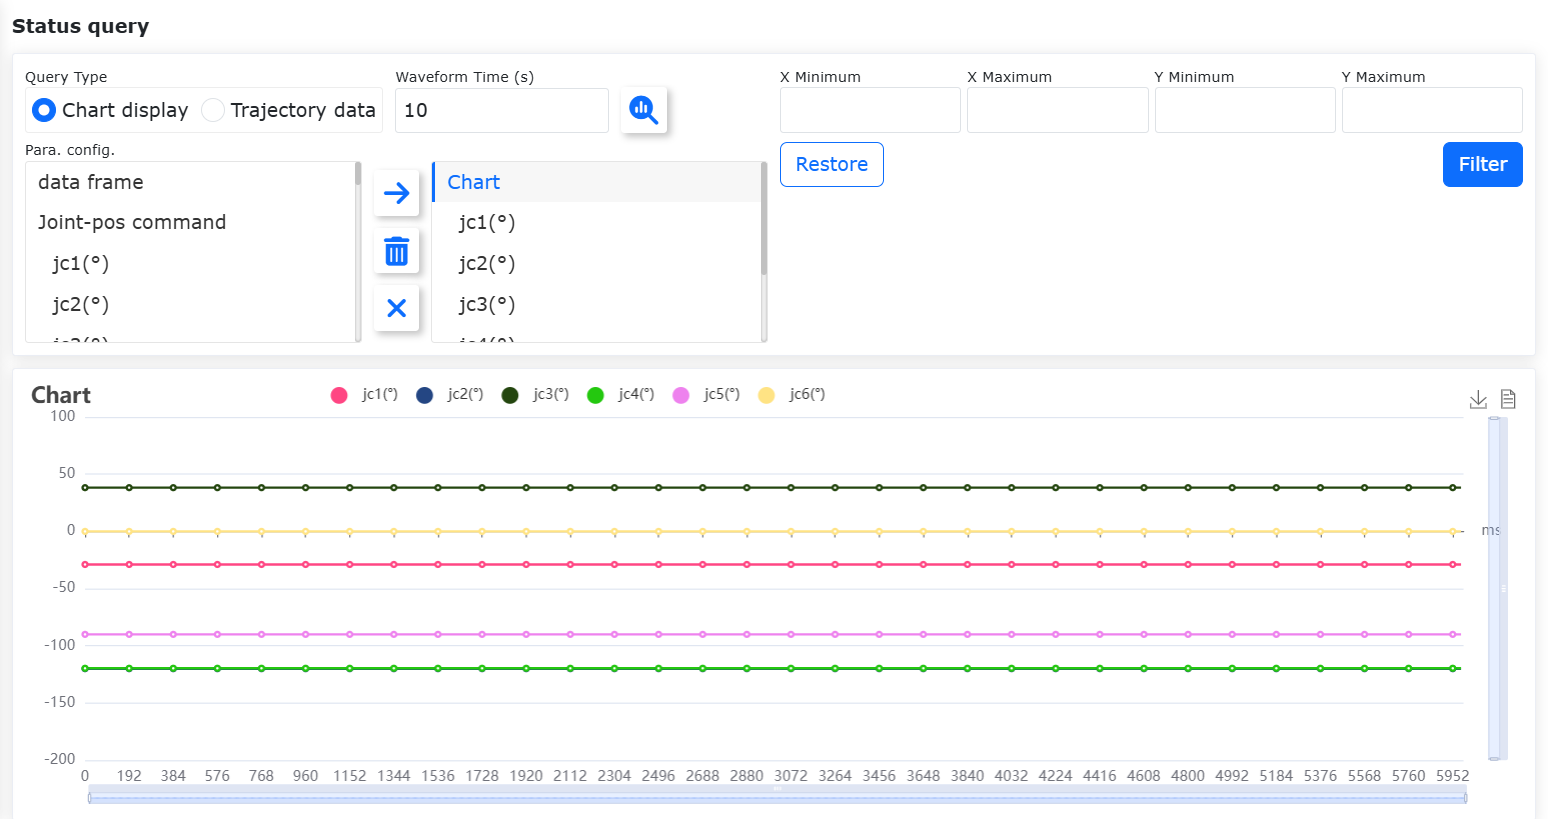
Figure 13.2‑8 Data Restoration